Table of Contents
Key Takeaways for Real Estate Investors (2026)
- Commercial growth fuels residential gains: Record 11.4 million sq ft office leasing in 2025 directly boosted 13–19% residential price growth.
- Office rents rising fast: 10% YoY increase in office rentals, among the highest in India, signals strong corporate demand.
- GCC-driven housing demand: 5.1 million sq ft leased by GCCs creates concentrated demand for nearby apartments.
- Job creation matters: 58,000+ IT jobs added translate into sustained home-buying and rental demand.
- Proximity premium is real: Homes within 5 km of office hubs appreciate 15–25% faster than peripheral locations.
- Rental yield linkage: 10% commercial rent growth → 6–8% residential rent increase, improving cash flows.
- Infrastructure multiplier: Office development accelerates metro, roads, and retail, lifting surrounding property values.
- Low vacancy = scarcity: HITEC City vacancy at ~6% tightens land supply, pushing both office and housing prices up.
- Premium housing demand rising: Professionals and GCC employees drive upgrades to larger, better-located homes.
Bottom line: Hyderabad’s strong office leasing engine creates a powerful commercial-to-residential value chain, making it one of India’s most compelling investor markets.
Understanding the Commercial-Residential Nexus
The relationship between commercial office leasing and residential apartment prices operates through three primary mechanisms: employment-driven housing demand where office space absorption creates direct need for nearby employee housing, infrastructure spillover effects as commercial development catalyzes roads, metro stations, retail, and social amenities benefiting residential values, and land market dynamics where competing demand for limited land in prime corridors creates upward price pressure across all real estate asset classes.
In Hyderabad’s case, this nexus is particularly pronounced due to concentrated employment in specific corridors (HITEC City, Gachibowli, Financial District), high-income professional workforce (average IT salaries ₹8-15 lakh) capable of premium housing costs, and limited land availability in established zones forcing residential development into concentric rings around commercial cores.
Understanding this relationship enables investors to anticipate residential price movements by tracking commercial leasing trends, acting as leading indicators for apartment appreciation in surrounding micro-markets.
2025: Hyderabad’s Record-Breaking Commercial Year
Leasing Volumes Hit All-Time Highs
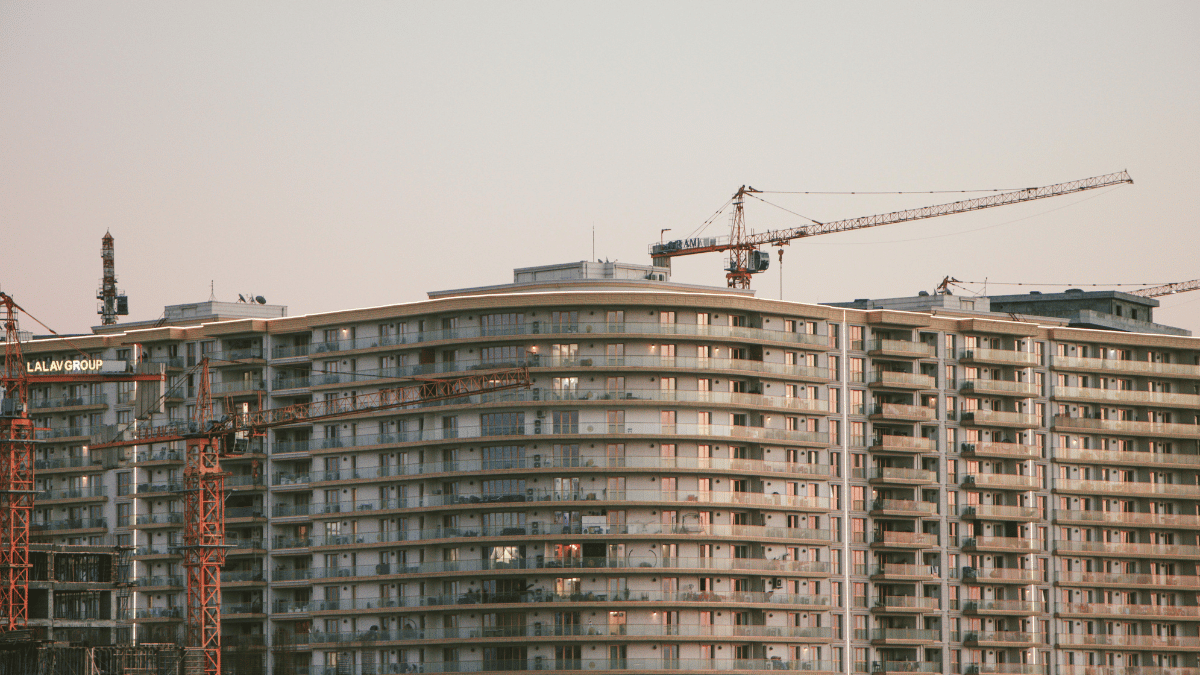
Hyderabad emerged as one of India’s strongest-performing office markets in 2025, recording its highest-ever annual leasing volumes amid sustained demand from Global Capability Centres (GCCs) and technology-led occupiers, leasing a total of 11.4 million square feet of office space during the year, marking a 10 percent year-on-year growth.
This 11.4 million sq ft represents significant employment addition. Assuming 150 sq ft per employee (industry standard), this translates to approximately 76,000 new job positions in 2025 alone. Each employee represents potential housing demand, many relocating to Hyderabad or upgrading accommodations upon job changes.
GCC-Led Demand Dominance
GCCs remained the dominant occupier segment, with Hyderabad recording 5.1 million sq ft of leasing by GCCs in 2025, underlining its strength as a preferred destination for global enterprises expanding research, technology and back-office operations.
GCC Impact on Residential: Global Capability Centers employ high-skilled professionals with salaries ₹12-25 lakh annually, demographics seeking premium 2-3BHK apartments in Gachibowli, Kondapur, and Financial District. Their preference for quality housing with modern amenities drives demand in ₹70 lakh-1.5 crore segments, sustaining price appreciation even during broader market corrections.
Office Rental Growth: The Price Signal
The city recorded a 10 percent year-on-year increase in office rentals in 2025, among the highest growth rates across major Indian office markets. Average rents stood at Rs 77 per sq ft per month in the second half of the year, reflecting rising landlord pricing power amid limited Grade A availability.
What Rising Commercial Rents Signal: When businesses willingly pay 10% more for office space, it confirms economic optimism, employment growth expectations, and perceived long-term value in Hyderabad location. This corporate confidence translates to employee hiring, creating ripple effects in residential demand within 5-10 kilometers of leased office spaces.
Looking for a Home That Reflects Your Lifestyle?
Discover thoughtfully designed homes by Kura Homes — where timeless architecture, modern comfort, and sustainable living come together.
Direct Correlation: Q3 2025 Case Study
Residential Prices Mirror Commercial Strength
Hyderabad’s real estate market recorded a strong 13–19% YoY price rise in Q3 2025, driven by robust office leasing, high-end housing demand, and favourable economic conditions.
The timing is critical: record commercial leasing in H1 2025 (5.7 million sq ft) preceded residential price acceleration in Q3 2025 (13-19% YoY), demonstrating 3-6 month lag between office absorption and residential price response.
Sentiment Index Correlation: The South Zone remained the most buoyant with a sentiment score of 62, driven by strong leasing momentum in Bengaluru and Hyderabad alongside sustained demand for high ticket size housing segments. This sentiment score, tracking developer, investor, and financial institution confidence, directly correlates commercial health to residential optimism.
Premium Segment Leadership
Demand in the premium residential segment remains healthy, while the office market continues to demonstrate structural depth with strong leasing pipelines. The premium segment (₹1 crore+ apartments) appreciation outpaced mid-segment growth, confirming that office sector professionals, particularly GCC employees, drive luxury housing demand.
Micro-Market Analysis: Where Commercial Leasing Drives Residential Prices
| Micro-Market | Commercial Office Stock | 2025 Office Rental Rate | Residential Price Range | YoY Residential Appreciation | Commercial Influence |
| HITEC City | 25+ million sq ft | ₹75-85/sq ft/month | ₹8,000-12,000/sq ft | 12-15% | Very High (6% vacancy, tight supply) |
| Gachibowli | 20+ million sq ft | ₹70-80/sq ft/month | ₹7,000-10,000/sq ft | 15-18% | Very High (major tech parks) |
| Financial District | 15+ million sq ft | ₹80-95/sq ft/month | ₹8,500-11,000/sq ft | 18-22% | Extremely High (SEZ, banking) |
| Madhapur | 10+ million sq ft | ₹65-75/sq ft/month | ₹6,500-9,000/sq ft | 10-13% | High (IT services companies) |
| Kondapur | 8+ million sq ft | ₹60-70/sq ft/month | ₹5,500-8,000/sq ft | 12-15% | Moderate-High (mixed use) |
| Kokapet | Emerging (5+ million sq ft planned) | ₹70-85/sq ft/month | ₹7,000-10,000/sq ft | 20-25% | High (WTC, new developments) |
HITEC City: The Epicenter
Vacancy in HITEC City is at 6%, while rents have climbed to ₹72 per sq ft per month. This 6% vacancy, near frictional minimum, indicates demand exceeding supply, creating landlord pricing power. As office rents rise, companies locate nearby to reduce commute burden for employees, driving residential demand in 3-5 kilometer radius.
Residential Impact: Between 2021-2024, HITEC City residential rental values grew 54% and capital values appreciated 62%, directly correlating to office sector expansion. Properties within walking distance (1-2 km) of major campuses command 15-20% premiums over similar properties 5+ kilometers away.
Financial District: The Premium Powerhouse
Financial District’s concentration of banks, consulting firms, and financial services creates highest-income professional density in Hyderabad. Commercial rents of ₹80-95/sq ft (highest in city) support residential prices of ₹8,500-11,000/sq ft, demonstrating how commercial rent ceilings enable residential price floors.
Employment Quality: Finance and consulting professionals earning ₹15-30 lakh annually seek premium gated communities with full amenities, driving demand for ₹1-2 crore apartments that would remain unsold in areas lacking employment density.
Kokapet: The Emerging Story
Kokapet demonstrates forward-looking commercial-residential correlation. The upcoming World Trade Center (15 lakh sq ft) and multiple Grade-A office projects create anticipation of employment influx, driving residential prices up 20-25% YoY despite offices not yet occupied.
Speculative Premium: Investors buying residential properties in Kokapet today are betting on 2026-2027 office occupancy creating 15,000-20,000 job positions. This speculative demand, supported by infrastructure (ORR connectivity, metro plans), demonstrates how commercial leasing announcements alone move residential prices.
Employment-Housing Demand Chain
From Office Space to Housing Need
Step 1: Company Leases Office Space
Multinational corporation signs lease for 100,000 sq ft in Gachibowli @ ₹75/sq ft/month. Total annual commitment: ₹9 crore.
Step 2: Employment Addition
100,000 sq ft ÷ 150 sq ft per employee = 667 employees. Assuming 40% relocations and 30% upgrades, 467 employees seek new housing within 12 months.
Step 3: Housing Absorption
467 employees × 70% renting + 30% buying = 327 renters + 140 buyers. These 140 purchase transactions and 327 rental agreements occur within 5-kilometer radius of office, creating demand surge.
Step 4: Price Response
Increased demand with limited supply (new residential projects take 24-36 months) raises prices 8-12% in first year, 5-8% in subsequent years until supply catches up.
Step 5: Developer Response
Observing appreciation, developers launch new residential projects 3-5 km from office zones, capitalizing on anticipated demand from future office absorption.
The Income-to-Rent Ratio
Commercial office rentals of ₹75/sq ft translate to companies paying ₹1.125 crore annually per 1,000 sq ft. This expenditure signals confidence in employee productivity and revenue generation, confidence that filters to employee compensation.
Residential Affordability Link: IT professionals earning ₹12 lakh annually can afford ₹35,000-40,000 monthly rent (30% of income) or ₹70-90 lakh property purchases. As more companies lease space and hire, this income cohort grows, expanding the buyer/renter pool for mid-premium housing.
Infrastructure Development: The Multiplier Effect

Commercial Development Catalyzes Infrastructure
Large office projects trigger infrastructure investments that benefit residential real estate disproportionately:
Metro Station Prioritization: Metro Phase 2 – From Raidurg to Kokapet and Nagole to the airport, set to boost property values by 10–20%. Metro routes are planned connecting employment zones to residential areas, commercial demand literally determines infrastructure routing.
Road Widening and Flyovers: High office density creates traffic congestion, prompting government road improvements. These upgrades benefit residential properties through reduced commute times and improved accessibility.
Retail and F&B Development: Office workers create daytime population supporting malls, restaurants, gyms, and entertainment. These amenities enhance residential livability, driving premiums for nearby apartments.
Social Infrastructure: International schools, premium hospitals, and lifestyle services cluster near high-income employment zones, creating comprehensive ecosystems that attract families and drive residential demand.
Land Value Spillover
When companies pay ₹75-85/sq ft commercial rent, it justifies land acquisition costs of ₹15,000-25,000/sq yd for developers. This land value floor elevates nearby residential land prices, if commercial land costs ₹20,000/sq yd, residential land 2 kilometers away cannot sell for ₹8,000/sq yd. Market forces create parity adjusted for use and density.
Supply-Demand Dynamics: The Scarcity Factor
Limited Office Supply Tightening Market
New office completions in the city stood at 4.3 million sq ft in 2025, representing a sharp year-on-year decline of over 70 percent. This supply-demand imbalance contributed to tightening availability of quality office space across prime micro-markets.
Residential Implication: When office supply cannot meet demand, companies compete for existing space, driving rents up 10% YoY. Simultaneously, land scarcity prevents both commercial and residential development, creating parallel price pressure. Developers face choice: build office (₹80/sq ft rent potential) or residential (₹7,000/sq ft sale), both options profit from scarcity, pushing residential prices upward.
The 70% Supply Decline Paradox
Why did office supply drop 70% when demand is robust? Construction financing constraints, land acquisition challenges, approval delays, and developer focus on residential (higher margins short-term) created supply gap. This gap ensures sustained commercial rent growth through 2026-2027, which will continue supporting residential appreciation.
Rental Yield Correlation: Investor Perspective
Commercial Rent Growth Enables Residential Rent Increases
When office rents rise 10% YoY, companies typically increase employee salaries 8-10% to retain talent in competitive market. Higher employee incomes enable landlords to raise residential rents 6-8% annually without affordability constraints.
Hyderabad Rental Yields: Residential rental yields of 3.88% (India’s highest metro) are sustainable because employment income supports rent payments. In cities with stagnant commercial markets, residential rents cannot rise without tenant pushback, limiting yield growth.
The Investment Calculus
Investors comparing commercial versus residential investment consider:
Commercial Office Investment:
- Yields: 7-9% (higher than residential)
- Lease Terms: 3-9 years (stability)
- Tenant Quality: Corporate (creditworthy)
- Vacancy Risk: Lower (long leases)
- Capital Requirement: High (₹2-5 crore minimum)
- Liquidity: Low (specialized buyers)
Residential Apartment Investment:
- Yields: 3-5% (lower but growing)
- Lease Terms: 11 months-2 years (flexibility)
- Tenant Quality: Individual (variable)
- Vacancy Risk: Higher (shorter leases)
- Capital Requirement: Moderate (₹50 lakh-1.5 crore)
- Liquidity: High (broad buyer base)
Residential Advantage: When commercial leasing is strong, residential yields compress (prices rise faster than rents) but capital appreciation accelerates, offering superior total returns for investors with 5-7 year horizons.
Looking for a Home That Reflects Your Lifestyle?
Discover thoughtfully designed homes by Kura Homes — where timeless architecture, modern comfort, and sustainable living come together.
Future Outlook: 2026-2027 Commercial-Residential Trends
Sustained Office Momentum Expected
With GCC-led demand continuing to anchor the market and limited supply supporting rental growth, Hyderabad is well positioned to remain a key driver of India’s office sector momentum as the market moves into 2026.
Residential Projection: If 2026 office leasing maintains 10-11 million sq ft (conservative estimate given GCC pipeline), residential prices in prime corridors will likely appreciate 10-15% driven by employment addition and sustained professional income growth.
Infrastructure Completion Amplifying Effects
Metro Phase 2 – From Raidurg to Kokapet and Nagole to the airport, set to boost property values by 10–20%. Metro completion in 2026-2027 will reduce commute times from emerging residential zones to office corridors from 60 minutes to 30-35 minutes, unlocking peripheral areas for professional housing and redistributing demand geographically.
Price Redistribution: Current price concentration in HITEC City-Gachibowli (₹8,000-12,000/sq ft) may moderate to 8-10% annual growth as metro-connected peripheral zones (Kokapet, Tellapur, Narsingi) appreciate 15-20% annually, benefiting from employment access without historical premium pricing.
The Hybrid Work Variable
Post-COVID hybrid work models (3-4 days office, 1-2 days home) haven’t reduced office leasing, Hyderabad recorded 11.4 million sq ft leasing in 2025, because absolute employment growth offsets per-employee space reductions. However, hybrid work is influencing residential preferences: demand increasing for 3BHK apartments with dedicated home office spaces, peripheral locations with better space-to-price ratios gaining appeal, and amenity-rich gated communities (for work-from-home lifestyle support) commanding premiums.
Investment Strategy Adjustment: Focus on 3BHK configurations in projects with robust clubhouses, co-working spaces, and high-speed internet infrastructure, catering to hybrid work professionals.
Investment Strategy: Leveraging Commercial Trends
Leading Indicator Monitoring
Track These Commercial Metrics:
- Quarterly Office Absorption: Sustained 2.5+ million sq ft quarterly signals strong residential demand ahead
- Office Rental Growth: 8-10% YoY rent increases predict 10-15% residential appreciation within 12-18 months
- GCC Announcements: New GCC setups create 500-2,000 jobs each, monitor corporate press releases
- Vacancy Rates: Rates below 8% indicate tight supply supporting price growth
- New Office Project Launches: Grade-A office construction announcements signal developer confidence and future employment
Location Selection Framework
Priority Tiers Based on Commercial Proximity:
Tier 1 (Highest Priority): Within 3 km of major office parks with proven absorption, metro-connected or ORR-adjacent for accessibility, established social infrastructure (schools, hospitals), and current vacancy rates under 8%.
Examples: Gachibowli (near DLF Cyber City, Mindspace), Madhapur (near Raheja Mindspace), Financial District (near Rajapushpa Summit, Skyview).
Tier 2 (Moderate Priority): 3-5 km from office clusters, metro planned (completion within 24 months), emerging social infrastructure, and current vacancy 8-12%.
Examples: Kondapur, Hafeezpet, parts of Miyapur.
Tier 3 (Speculative/Long-Term): 5-10 km from offices, metro/ORR connectivity planned but uncertain timing, limited current social infrastructure, and vacancy rates variable.
Examples: Tellapur, Narsingi outskirts, Kollur.
Timing Strategy
Entry Points:
- Immediate: Tier 1 locations showing 10%+ office rental growth, appreciation already underway but sustainable
- 12-18 Months: Tier 2 locations when major office projects announced or leasing commitments secured
- 24-36 Months: Tier 3 locations after infrastructure groundwork visible and initial commercial activity commenced
Exit Planning: Hold 5-7 years minimum in Tier 1, 7-10 years in Tier 2, 10+ years in Tier 3, allowing commercial ecosystem to fully mature and residential prices to reflect employment density.
Risk Factors and Mitigation
Commercial Sector Vulnerabilities
IT Sector Concentration: 70% of office leasing is technology-related. Prolonged tech downturn would reduce leasing, slow hiring, and moderate residential demand.
Mitigation: Diversify across micro-markets, mix IT-heavy Gachibowli with Financial District (finance) and emerging zones (mixed employment). Avoid 100% exposure to single employment sector.
Global Economic Headwinds: Recession in US/Europe could reduce GCC expansions and IT services exports, impacting Hyderabad employment.
Mitigation: Focus on end-user driven residential projects (70% self-use buyers) rather than pure investor-driven luxury. End-users provide demand stability during economic uncertainty.
Oversupply Risk: If residential developers aggressively launch projects anticipating employment growth that doesn’t materialize, oversupply could pressure prices.
Mitigation: Monitor inventory-to-sales ratios. Healthy ratio: 12-18 months inventory. Above 24 months signals oversupply risk, delay purchases until absorption improves.
Frequently Asked Questions (FAQs)
1. How fast do apartment prices react to office leasing?
Prices move with a 3–6 month lag within 3 km of offices and 12–18 months in 5–10 km zones. Leasing today signals housing demand next.
2. Which apartment types benefit most?
2–3BHK (1,000–2,000 sq ft) see the fastest absorption and best resale. They match IT/GCC employee demand. Avoid 1BHK and ultra-luxury 4BHK+ for office-led plays.
3. Do office rent hikes lift home rents?
Yes. 10% office rent growth → 6–8% residential rent increase, usually with a 6–12 month lag.
4. Should I buy near offices before they’re occupied?
Can work, but risky. Best entry is 12–18 months before office occupancy, after construction is visible and tenants are committed.
5. How do I spot the next growth micro-markets?
Track office park announcements, metro/road projects, large land parcels, and GCC clustering. Watch Kokapet, Gachibowli belt, Airport corridor, Uppal-Pocharam.
6. If office demand slows, will apartment prices crash?
Unlikely. With 70% end-users, prices may pause or grow slower, not crash. Past downturns saw only 5–10% temporary corrections.
7. Financial District vs emerging zones, what’s safer?
Financial District: Lower risk, steady returns, higher entry price.
Emerging zones: Higher risk, higher upside, longer holding needed.
Ideal mix: 60–70% established, 30–40% emerging.
8. How do I verify commercial leasing data?
Use Knight Frank, JLL, Cushman & Wakefield reports, RERA records, site visits, broker checks, and corporate announcements. Avoid single-source claims.
Conclusion: The Inextricable Link Between Commercial and Residential
The question “How do commercial leasing trends influence apartment prices?” reveals Hyderabad real estate’s fundamental dynamic: employment creates housing demand, and housing demand creates price appreciation.
Hyderabad’s 11.4 million sq ft office leasing in 2025 with 10% year-on-year growth directly translated to 13–19% residential price increases in Q3 2025. This isn’t coincidence, it’s economic cause and effect operating through employment addition, income growth, and proximity premiums.
The Investment Thesis:
Commercial Strength Predicts Residential Appreciation: Track quarterly office absorption, rent growth, and GCC expansions as leading indicators for residential investment opportunities 3-6 months ahead.
Location Proximity Matters Immensely: Properties within 3-5 km of major office clusters capture maximum appreciation through employee housing demand, infrastructure spillover, and land value escalation.
Configuration Alignment Essential: 2-3BHK apartments matching IT professional demographics (singles, young families, home office needs) benefit most from employment-driven demand versus niche configurations.
Long-Term Compounding: Commercial-residential correlation compounds over 5-10 years, initial employment boost drives prices up, attracting more commercial development, creating virtuous cycle of appreciation.
Risk Management Through Diversification: Mix established corridors (Financial District, HITEC City) with emerging zones (Kokapet, Airport corridor) balancing stability and growth while mitigating single-location concentration risk.
For Investors in 2026:
Hyderabad’s commercial momentum is well positioned to remain a key driver of India’s office sector momentum as the market moves into 2026, making residential investments near office corridors among India’s most compelling risk-adjusted opportunities.
The residential real estate winners won’t be those chasing random “hot localities” but those strategically positioning near employment concentrations, letting corporate India’s office expansion decisions guide their own investment allocation.
In real estate as in life, follow the jobs, and prices will follow.
Build Where Employment and Opportunity Converge
Kura Homes brings nearly five decades of Hyderabad real estate expertise with deep understanding of how employment corridors and residential demand intersect. Our projects prioritize strategic locations balancing workplace accessibility, infrastructure connectivity, and community livability, recognizing that homes serve families whose careers and commutes shape daily satisfaction.
Whether investing for appreciation or purchasing for residence, our commitment to quality construction, transparent practices, and customer-centric design ensures properties that deliver long-term value rooted in location fundamentals, not speculative trends.
Explore residential opportunities in Hyderabad’s employment-driven growth corridors. Connect with Kura Homes today.
Disclaimer: Commercial leasing data, residential price trends, and correlation analysis reflect 2025-2026 market conditions and may vary based on economic factors, employment patterns, and unforeseen developments. This article provides educational analysis, not personalized investment advice. Past correlations between commercial and residential markets do not guarantee future relationships.